

In the current landscape of the US housing market, prospective homebuyers are grappling with unprecedented challenges. The National Association of Realtors’ (NAR) latest Q3 report reveals a concerning trend: home affordability has hit its lowest point since 1985, presenting a stark contrast to the rising home values. This article explores the 25 metropolitan areas where home prices have witnessed a significant decline, offering potential buyers a glimmer of hope in an otherwise tough market.
National Overview: The Affordability Crisis
The NAR’s data underscores the severity of the situation. The median US home price in Q3 2023 reached $406,900, marking a 2.2% increase from the previous year. Compounding the challenge, mortgage rates soared to a 23-year high, ranging from 6.8% to 7.3%. This has led to a 6.9% increase in the average monthly payment for a standard starter home with a 10% down payment, making homeownership an uphill battle.
The 25 Cities Where Hope Prevails
Contrary to the overall upward trend, 25 metropolitan areas experienced a decline in home prices during Q3 2023. These cities provide a unique opportunity for potential buyers to navigate a buyer’s market, escaping the nationwide affordability crisis.
1. Austin, Texas

Year-over-year price change: -10.3%
Median home price in Q3 2023: $485,700
Median home price in Q3 2022: $541,600
Austin, a city known for its vibrant culture and tech scene, takes the lead with a substantial 10.3% decrease in home prices. This presents a unique opportunity for prospective buyers in a market that has otherwise been characterized by relentless growth.
2. Honolulu, Hawaii

Year-over-year price change: -5.8%
Median home price in Q3 2023: $1,061,900
Median home price in Q3 2022: $1,127,400
Even the paradisiacal shores of Honolulu are not immune to the market forces driving prices down, offering a glimpse of relief to those aspiring for homeownership in the Pacific.
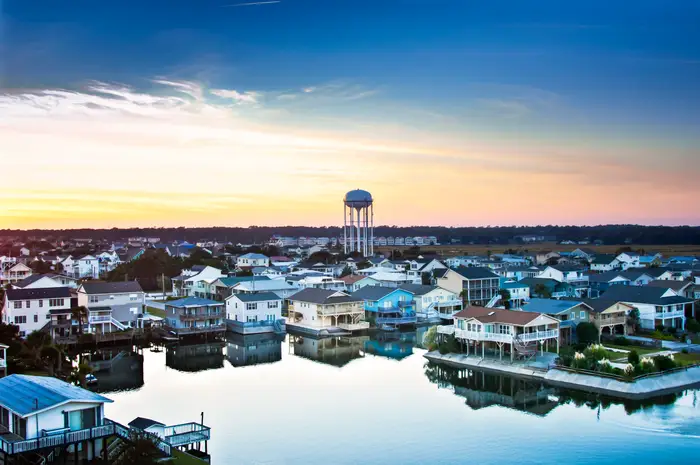
3. Jackson, Mississippi

Year-over-year price change: -4.8%
Median home price in Q3 2023: $234,200
Median home price in Q3 2022: $246,000
In the heart of the Deep South, Jackson experiences a 4.8% dip in home prices, bringing renewed hope to the local real estate landscape.
4. Shreveport, Louisiana

Year-over-year price change: -4.6%
Median home price in Q3 2023: $210,500
Median home price in Q2 2023: $224,800
Median home price in Q3 2022: $220,600
5. Cape Coral, Florida

Year-over-year price change: -3.6%
Median home price in Q3 2023: $405,000
Median home price in Q2 2023: $439,000
Median home price in Q3 2022: $420,000
6. St. George, Utah

Year-over-year price change: -3.6%
Median home price in Q3 2023: $541,900
Median home price in Q2 2023: $548,000
Median home price in Q3 2022: $561,900
7. Provo, Utah

Year-over-year price change: -3.5%
Median home price in Q3 2023: $532,700
Median home price in Q2 2023: $520,300
Median home price in Q3 2022: $552,200
8. Logan, Utah

Year-over-year price change: -3.3%
Median home price in Q3 2023: $421,000
Median home price in Q2 2023: $440,600
Median home price in Q3 2022: $435,200
9. San Antonio

Year-over-year price change: -3.1%
Median home price in Q3 2023: $332,200
Median home price in Q2 2023: $334,100
Median home price in Q3 2022: $342,700
10. Baton Rouge, Louisiana

Year-over-year price change: -2.9%
Median home price in Q3 2023: $263,700
Median home price in Q2 2023: $268,600
Median home price in Q3 2022: $271,600
11. Kennewick, Washington

Year-over-year price change: -2.5%
Median home price in Q3 2023: $433,600
Median home price in Q2 2023: $428,900
Median home price in Q3 2022: $444,700
12. Macon, Georgia

Year-over-year price change: -2.4%
Median home price in Q3 2023: $219,200
Median home price in Q2 2023: $219,900
Median home price in Q3 2022: $224,600
13. Jacksonville, Florida

Year-over-year price change: -2%
Median home price in Q3 2023: $390,000
Median home price in Q2 2023: $390,900
Median home price in Q3 2022: $398,000
14. Chico, California

Year-over-year price change: -1.8%
Median home price in Q3 2023: $424,700
Median home price in Q2 2023: $412,900
Median home price in Q3 2022: $432,500
15. Myrtle Beach, South Carolina
Year-over-year price change: -1.8%
Median home price in Q3 2023: $366,700
Median home price in Q2 2023: $368,300
Median home price in Q3 2022: $373,400
16. Punta Gorda, Florida
Year-over-year price change: -1.8%
Median home price in Q3 2023: $374,400
Median home price in Q2 2023: $380,000
Median home price in Q3 2022: $381,100
17. Salem, Oregon

Year-over-year price change: -1.7%
Median home price in Q3 2023: $456,200
Median home price in Q2 2023: $451,000
Median home price in Q3 2022: $464,000
18. Crestview, Florida

Year-over-year price change: -1.6%
Median home price in Q3 2023: $407,000
Median home price in Q2 2023: $432,000
Median home price in Q3 2022: $413,700
19. Lakeland, Florida

Year-over-year price change: -1.5%
Median home price in Q3 2023: $335,000
Median home price in Q2 2023: $335,900
Median home price in Q3 2022: $340,000
20. Pensacola, Florida

Year-over-year price change: -1.5%
Median home price in Q3 2023: $325,000
Median home price in Q2 2023: $330,000
Median home price in Q3 2022: $330,000
21. Phoenix

Year-over-year price change: -1.5%
Median home price in Q3 2023: $467,200
Median home price in Q2 2023: $464,200
Median home price in Q3 2022: $474,400
22. Yakima, Washington
Year-over-year price change: -1.4%
Median home price in Q3 2023: $354,300
Median home price in Q2 2023: $356,700
Median home price in Q3 2022: $359,200
23. Salt Lake City

Year-over-year price change: -1.2%
Median home price in Q3 2023: $554,500
Median home price in Q2 2023: $546,900
Median home price in Q3 2022: $561,200
24. Dallas

Year-over-year price change: -1.1%
Median home price in Q3 2023: $385,700
Median home price in Q2 2023: $389,800
Median home price in Q3 2022: $390,100
25. Houston

Year-over-year price change: -1.1%
Median home price in Q3 2023: $345,600
Median home price in Q2 2023: $348,300
Median home price in Q3 2022: $349,500
The Economic Dynamics at Play
Homeowners’ Dilemma
Homeowners find themselves at a crossroads – reluctant to incur exorbitant borrowing costs by moving, yet benefiting from rising home values due to limited supply. This dilemma creates a self-reinforcing cycle where a scarcity of Housing Market options propels prices to new heights.
Accumulated Wealth
Lawrence Yun, the NAR’s chief economist, highlights that homeowners have accumulated substantial wealth, with the typical homeowner gaining over $100,000 in overall net worth since 2019. However, this prosperity comes with a caveat – the persistent scarcity of available homes could thwart the homeownership dreams of younger adults unless Housing Market supply undergoes a significant boost.
Conclusion
In conclusion, as the broader real estate Housing Market grapples with soaring prices and unprecedented mortgage rates, a glimmer of hope emerges from the 25 cities where home prices are bucking the trend. These cities provide a unique window of opportunity for buyers navigating the challenging landscape of the current housing market. As we navigate these complex dynamics, it becomes evident that a nuanced understanding of localized trends is essential for both buyers and sellers seeking to make informed decisions in this ever-evolving real estate panorama.